


Ⅰ. Introduction
Housing construction has a critical role in housing market dynamics. In the short run, rents may increase drastically as positive shocks occur in some ex ante housing demand drivers, such as employment and in-migration of population, which could in turn exaccerbate the housing affordability. Housing prices silimarily go up as the cost of capital gets cheaper. The previous short-run dynamic disequilibrum could be directed to a new equilibrium when construction arrives at the market. The increase in the demand for housing can be absorbed (with some lags), and therefore the prices will be eventually stabilized to get to a new steady state.
This study examines the role of housing supply in the housing market dynamics in Korea. In the Korea’s housing market, there is a unique rental tenure system, called ‘Jeonse’. Jeonse tenants pay a significant of amount of money to the owner of the house. In return, they can live in the house for certain period of time (typically, two years) without any further monthly payment.
The fluctuation in the demand for Jeonse market has an implication for the buyers, particularly in the market for newly-delivered housing units — for the apartment housing market more precisely. The Jeonse deposit functions as the most important financing tool for the buyers. If buyers fail to find a Jeonse tenant with a reasonable Jeonse deposit, some new home buyers’ credit crunch make them almost impossible to purchase a housing unit.
This paper investigates firstly whether or not the housing price, the Jeonse price and the construction can explain the short-run dynamics of housing market in Korea. This study further tests if construction affects which sides of the housing markets in Korea.
Ⅱ. Housing Market Dynamics in Korea
Table 1 illustrates the recent ups-and-donws in apartment sales and Jeonse prices by region. While apartment sales prices have increased nationwide, some regions show decreases in price. In Daegu, one of the metropolitan cities, the sale price has been dropped in June 2016 and in June 2017. Some non-Seoul metropolitan regions, such as Chungbuk, Gyeongbuk, and Gyeongnam, have suffered from the incessant decrease in the sale price.
Source: Korea Appraisal Board(2018).
In the construction sector, the above-average permits and starts in 2015, 2016, and 2017 resulted in the fall in housing supply in 2018. If we assume that the historical average of apartment construction is about 300,000 units per year, we have witnessed a great deal of expansion in the apartment construction sector from 2013 up to date. In 2017, the flow of construction peaked at 569,209 units. Now, we anticpate a huge drop in the new construction in the coming years.
Source: Korea Appraisal Board(2018).
There are research papers on the housing market dynamics in Korea. Park and Ahn (2009) investigated the factors of housing price functuations in Seoul, Korea. They found that the prices are affected by the macroeconomic condition and the prices in the adjacent locations. Lee (2010) analyzed the linkage between housing prices and Jeonse prices using the vector error correction methodology. The study found the cointegrating relationship between the two. The long-run elasticity of Jeonse to price is estimated as 0.575 with a slow speed of adjustment. Kim and Lee (2011) examined the factors affecting housing prices using the panel unit root and panel cointegration tests. They also found the cointegration between the sale and Jeonse prices. They emphasized that region-specific characteristics are the important factors in determining the prices. Fousing on the macroeconomic liquity on housing prices, Lim (2015) found that interest rates change both stock prices and housing prices. Yoon et al. (2016) applied the panel vector error correction model to investigate the short-run and long-run effects of regional housing prices. They found that the patterns of short-run and long-run dynamics behave differently, and thus the policy responses should be designed to address the discrepancy in the market. A similar research was conducted for the regional housing prices using panel VAR by Koo and Choi (2018). The paper particularly focused on the comparison before and after of the 2008 global financial crisis. They found that it is important to understand the region-specific environment for the determination of housing price movement.
As for the construction sector, Ji et al. (2018) analyzed the factors on the time gap between housing permit and housing construction. They found that the gap resulted from the macroeconomic and socio-economic characteristics, predicting that low birth rate and rapid aging will limit the housing supply. Seo and Kim (2018) looked at the causal relationship between housing and construction. They found a statistically significant negative impact of the interest rate on all of the housing market variables, concluding that the market should keep vigilant watch over the changes in macroeconomic condition. For the role of land prices on housing construction, You (2018) concluded that housing starts are determined by housing prices positively and by land prices negatively.
This study contributes to the existing literature by examining the role of housing supply in the sales and the rental markets. When the positive demand shock arrives at the housing market system, the rental price of housing should rise, and the value of housing correspondingly increases. This short-run disequilibrium between housing stock and prices may excerbate the affordability of housing throughout the market, particularly in the market where the supply is highly inelastic. A new flow of housing supply should result in the adjustments in the stock and prices of housing, ending up with getting to a new, stable equilibrium. This paper tests whether or not this adjustment process exists in the Korea’s housing market.
Ⅲ. A Panel VAR Approach
From Sims(1980), there have been a great deal of studies, which applied the vector autoregressive (VAR) models. In the VAR framework, all the variables entered into the system are considered endogenous. The VAR system has proved to be a highly flexible model in explaining the dynamics of economic and financial markets. Although it is atheoretical per se in that it does not need any identifying assumption to draw the causal interpretation between some factors and the outcome variable of interest, the VAR estimation is very useful to figure out the interconnectivity of the variables and to forecast the future values of the variables considered in the model. The model applies when each variable depends on both its own lags and the ones of the other variables. Consider the following bivariate VAR system (VAR(2)):
where E(ϵ1tϵ2s) = σ12 for t = s and zero for t≠s. We can arrage the terms of the lag variables, and yields and E(ϵt) = 0, E(ϵtϵs) = 0 for t ≠ s andUsing the lag operator Φ(L) = I2−Φ1L−Φ2L2 such that Φ(L)xt = I2xt−Φ1xt−1−Φ2xt−2, the moving average, MA(∞), representation of the Equation 1 is
where Ψ(L) = (I2−Φ1L−Φ2L2)−1.A problem should arise when we apply the VAR approach to model a national housing market: it cannot capture the unobserved random spatial heteogeneity, which indicates each region’s innate time-invariant characteristic. This probem can be solved when we expand the dataset to a panel structure. Suppose we have a set of regions (i = 1,…,n), each of which is observed at multiple periods (t = 1,…,n). Let yit be the outcome variable of interest. The set of the independent variables that varies over time is denoted as xit. Then, the model we want to specify takes the following form:
where μi is a constant (or an intercept) that could be different in each period, and β is the coefficient vector. One should note that there are two random terms in Equation 3. While ϵit varies over time across regions, the term αi only varies regions, not over time period. The former represents the pure random shock to the system, but the latter captures all the unobserved variations that do not change over time. If we take αi as the parameters to be estimated, we can obtain the unbiased estimators for β via the following between-groups transformation.The between-group mean equals αi because αi is time-invariant. Therefore, estimating the Equation 4 is equivalent to cancelling out the effect of spatial heterogeneity. This study utilizes the VAR framework and the panel data structure at the same time, winding up with the use of the panel VAR approach.
This paper considers a 4-variate panel VAR of order 1 with region-specific fixed effects. Then, the panel VAR(“PVAR”, hereafter) system takes the following linear equations:
where Yi,t is a four-variable vector {PRICE, JEONSE, PJR, COMP}; PRICE is the sales price for apartment, JEONSE is the “Jeonse” price for apartment, PJR is the ratio of PRICE to JEONSE, and COMP is the number of housing units completed. ui represents the region-specific fixed effects, and Θ is the matrix of (4×4) parameters. The fixed effects model works under the Helmert (forward-orthogonal) transformation, which cancels out the factors that do not vary in time.As in the cannonical VAR model, the impulse-response function can be expressed as the MA(∞) process:
The impluse-response functions illustrate how one variable in the system reacts to the shocks in the remaining variables. We, however, cannot draw any causal relationship through the simple IRF. Since the random fluctuations and innovations of the variables in ϵi,t are correlated, an innovation in a variable should be correlated by shocks in other variables. Therefore, we cannot hold the shocks in other variables zero when describing the reactions of other variables to the variable of interest. As per Sims (1980), we may use the Cholesky decomposition to isolate those contemporaneous responses. As the decomposition varies with the ordering of variables, we need the identifying assumption for the causal linkages among the specified variables. This study adopts the Cholesky decomposition of variance-covariance matrix of residuals. This corresponds to the application of the recursive VAR structure (Hamilton 1994).
The specification in this study assumes that the shock to housing supply (proxied by the housing units completed) affects the Jeonse price. The first positive shock in housing supply means that units completed arrive at the housing market. The second shock is a shock to Jeonse that is orthogonal to the housing supply shock. This second shock reflects that the increase in the newly-built housing units leads to the decrease in the Jeonse price in the short-run. The change in Jeonse results in the change in the sales price. Finally, the housing sales price affects the sale price-to-Jeonse ratio. In the later of this paper, the PVAR system and the resulting PVAR Granger causality test will address whether or not the identifing assumption is feasible.
In a typical VAR, forecast error variance decomposition (FEVD) represents what amount of the forecast error variance of a variable can be explained by the shocks to the other variables in the system. The difference of the set of dependent variables at time t+h, Yi,t+h, to the h-step ahead vector of explanatory variables at time t is the h-step ahead forecast-error:
Then, the h-step ahead forecast-error variance of variable k is
The variance decomposition also varies with the ordering of variables. The ordering here follows the same as set out for the impulse-response function.
Ⅳ. Data Description and Estimation Results
The region-level, monthly data are provided by the Ministry of Land, Infrastructure and Transport, and publicly available. The data set is constructed by region (metroplitan cities or provinces) with the time period of 2012.1∼2017.11. The data from 2017.12 to the current month are excluded from the anlaysis because the data delivery organization (Korea Appraisal Board) has applied a new sampling and weighting scheme so that the data for the later period do not seem to be comparable to the previous time periods. The PPG variable refers to the growth rate of apartment sales price, the JPG variable means the growth rate of apartment Jeonse price, and the PJRD variable is the percentage change of the sales-to-Jeonse price ratio.
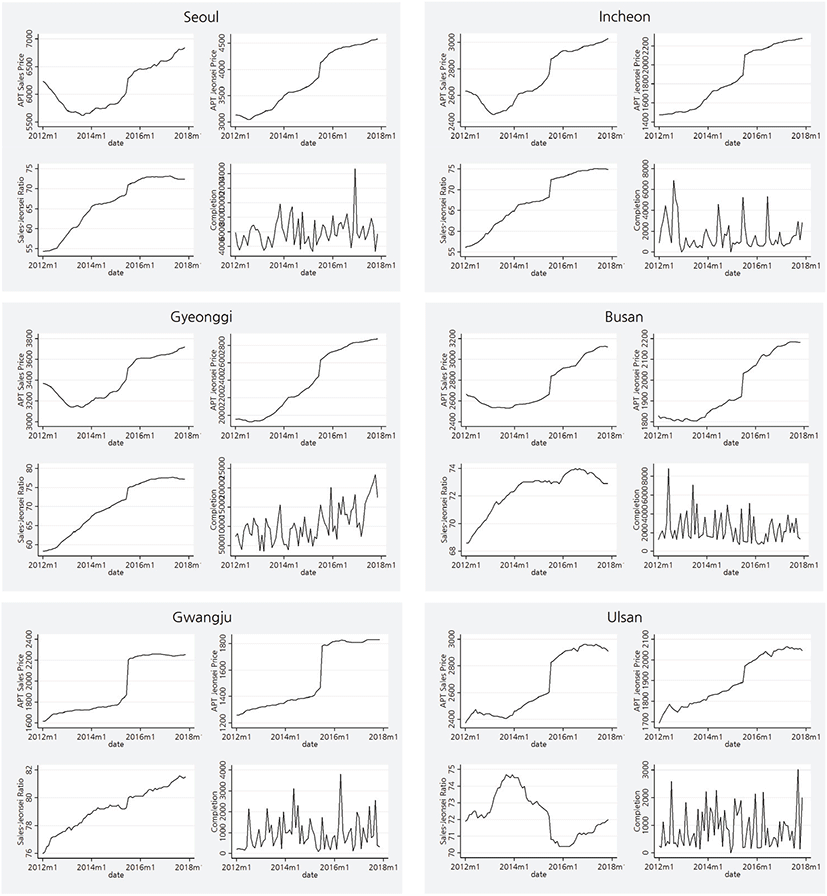
As for the sales prices and Jeonse prices, areas in the Seoul Metorpolitan region, that are Seoul, Incheon, and Gyeonggi, show the similar patterns. While Jeonse prices have gone up gradually during 2012 to 2017, the sales prices have decreased from 2012 to 2013 and picked up since 2014. The units completed show seasonaility and local flunctuation. The Gyeonggi region exhibits general upward trend in construction, reflecting the fact that there have been a continuous designation of new town development and land development in the region in order to decentralize the population in Seoul to the region.
The ratios of price to Jeonse for the Seoul Metropolitan areas gradually increase while Ulsan exhibits ups and downs. The ratio in Gwangju already picked up over the 80 percent around 2016 and keeps up, reflecting the use value and the transaction value of houses do not show much difference in that region.
The Harris-Tzavalis unit-root tests for the VAR variables are performed whether or not the time series variables are non-stationary and contain unit roots. The tests for PRICE, JEONSE, and PJR variables cannot reject the null hypothesis that the variables contain unit roots. As the result from the panel unit root test suggests that unit roots exist in PRICE, JEONSE, and PJR, I converted PRICE and JEONSE to the growth rate metrics (PPG and JPG, respectively) while transforming the price-to-Jeonse ratio to the percent change measure (PJRD). The null hypothesis that the number of housing units (COMP) has a unit root was strongly rejected, meaning that the COMP variable can be entered into the PVAR system as its original level form.
Note: H0 = Panels contain unit roots.
In order to select the final appropriate model, several models are estimated by specifying different instrument lags (see Table 5). Instrumenting the explanatory variables in each equation with their own lags makes the model to yield more significant coefficients and to be more stable. Among the models with instruments, the model with first to ninth lags as instruments is chosen to produce impulse response functions and variance decompositions.
Note: Model 1-1 did not use any instruments in each equation.
* p<0.1, ** p<0.05, *** p<0.1
p-values in parentheses
After choosing the model with 1-9 lags of the variables as instruments, the PVAR systems with different lags were specified. In the completion equation, adding more lags makes the coefficient of the 1st lag of the complition smaller (from 0.3998 to 0.269). Except for the own variable, only the ratio of sales to Jeonse negatively influence the completion.
Housing supply (completion) affects the sales price, the Jeonse price, and the ratio. Those effects are all negative in the short run. The growth in the sales price results in the growth in the Jeonse price, but the growth in the Jeonse price reduces the growth in the sales price. The latter does not mean that the Jeonse price (level) decreases the sales price (level). When the sales price goes up, the buyers can or should raise more Jeonse deposit to purchase a unit. This works as the sales market is in the buyer’s market. When the growth in the Jeonse price increases in the short run, the speed in the growth in the sales price does not catch up the growth in the Jeonse price, which makes the ratio of sales-to-Jeonse price to increase higher.
This study chooses the 1st-lag and 1-9th instrumental lags specification as the final model because it shows the dynamics explained above more significantly (Model 2-1 in Table 6).
Note: L., L2., and L3. indicate the first-order, second-order, and third-order lag operator, respectively.
* p<0.1, ** p<0.05, *** p<0.1
The main research focus is whether or not the newly-supplied housing units have an impact on the rental (Jeonse) housing market. Indeed, the units completed Granger-causes the growth of Jeonse price, but the opposite direction is not statistically significant in the PVAR(1) system (the p-value for the JPG to COMP causality test is 0.123). JPG Granger-causes only PPG. Then, PPG Granger-causes PJRD, which is in line with the PVAR(1) with 1∼9 lags of instruments model. The PJRD variable then Granger-causes the units completed. The PVAR Granger causality test, therefore, suggests the interretionships among construction and prices in the Korea’s housing market are described as COMP → JPG → PPG → PJRD. Furthermore, all the eigenvalues (not reported here) for the PVAR system lie inside the unit circle, meaning the system is stable.
First of all, all the impulse response functions illustrate that the PVAR model is stable. When the positive shocks in impulse variables move the response variables, and then go back to the original states. When the positive shock arrives at the housing supply, the growth in the Jeonse price initally slows down in the very short time period around 2 months, then slowly goes back to the original state (or a new equilibrium point). The positive shock in the Jeonse price growth shoots up the sales price growth, and then after 3 month or so, the change goes to 0 (zero). The difference in the sales-to-Jeonse ratio negatively responses and goes back as the sales price increses higher. Finally, housing supply decreases very shortly and goes back as the ratio of sales-to-Jeonse prices gets bigger.
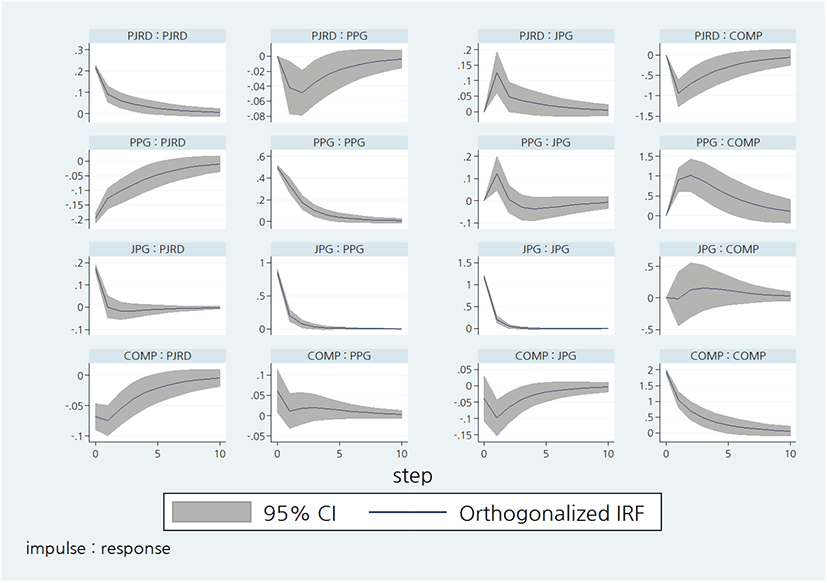
The proportion of the variability of the housing units completed get smaller as time (months) elapses. After ten month, the completion accounts for only 50 percent of the variance of the completion itself. Rather, the Jeonse market does not seem to be explained much by other market variables.
The variability of the ratio of the sales price-to-Jeonse is explained by 74.4 percent in JPG and only by 25.2 percent in the ratio variable. When it comes to the growth in the sales price, the JPG and PJRD variables together explain more than 50 percent of the variance of the price growth after 10 months from the initial shock. It seems that much of the volatility in the housing market come from the flunctuation in the Jeonse market. And it is expected that the movements in the Jeonse market are originated from the positive shocks in the demand for space and in the housing supply.
Ⅴ. Conclusion and Further Research Directions
In Korea, sales and rental markets are highly interconnected. In the most Western countries, income streams can be devoted to the rents, whereas the Jeonse tenants should pay a significant portion of the value of housing to live in a decent environment. For owners, the ‘Jeonse deposit’ plays an important role in financing for housing. The flow of housing supply leads to the fluctuations in both sides of the makets: sales and Jeonse.
This research found that construction leads to the decrease in the growth of the Jeonse price with controlling for other heterogenous regional characteristics. However, the shock in the Jeonse price growth does not exert a significant effect on the construction. It is expected that the growth in the sales price leads to the upward movement in the housing supply. In addition, the growth in the Jeonse price results in a sudden increase and a drastic stabilization in the sales price.
The findings may reflect the recent trend in the construction sector, that is ‘housing overbuilding and sudden downward adjustment.’ As the sales price picked up in the middle of 2010’s, a great deal of housing units have been delivered because the price could support the replacement cost. Now, we are witnessing that an abrupt increase in housing supply leads to the decrease in the Jeonse price, which could in turn create the ‘reverse-Jeonse’ problem. In a normal, unregulated market that does not make buying more difficult, the housing price will fall because the Jeonse deposit still plays a critical role in financing for buyers. Subsequently, the construction industry will wither in a couple of years. As owners want to move to the other housing units, either owning or renting, the market price for housing will fall below the reservation price for owners. This makes a fraction of population locked in the current location. In the long run, cheaper Jeonse price leads to a new flow of Jeonse tenants, and consequently the price will recover. Construction will then occur as the price begins to rise again.
This research applied a simple PVAR methodolology to illustrate a snapshot of housing market operation in Korea, investigating how construction plays a role in sales and rental markets, and what the subsequent movements would occur in which sides of the markets. Future research could adopt more rigourus econometric treatment to address the long-run relationships among sales, Jeonse markets, and the construction sector. One candidate would be an error correction model to derive the long-run behaviors of the construction-sales price linkage; or the construction-Jeonse price association.